
The Center for Data Innovation spoke with Michael Morehead, co-founder of syGlass, a West Virginia-based company that enables researchers to explore and annotate massive datasets more efficiently by combining immersive 3D visualization with AI-assisted analysis. Morehead described how syGlass helps scientists turn static datasets into interactive environments, speeding up scientific discovery, improving accuracy, and opening new possibilities for research, education, and collaboration.
David Kertai: How did syGlass get started?
Michael Morehead: syGlass started with a straightforward goal: to help scientists make sense of large and complex 3D images. The idea began at West Virginia University, where I worked with neuroscientist George Spirou. At the time, researchers were generating highly detailed 3D scans of brain tissue and other biological structures, but even though the data was 3D, scientists had to interpret it on standard 2D screens. That made it hard to see the shape and depth of what they were studying. We wanted to change that using stereoscopy, a method where slightly different images are shown to each eye, creating a real sense of depth.
To test the idea, we built a CAVE, or Cave Automatic Virtual Environment, around 2012. It was essentially a room where multiple flat screens projected stereoscopic images on the walls. With 3D glasses and head tracking, researchers could move around and view the data with a sense of depth. It improved the experience, but only to a point. Some datasets, like high-resolution embryo scans, are hundreds of gigabytes in size so even with the added depth cues, it was still difficult to explore internal structures or navigate through the volume. That limitation pushed us toward virtual reality, which allowed for more intuitive, immersive exploration.
By 2014, we began developing our own VR software that allows scientists to better interact with their massive 3D image datasets, enabling them to effectively “walk through” and analyze complex internal structures that were previously impossible to explore. While early versions handled smaller files, researchers from the Howard Hughes Medical Institute showed us datasets as vast as 20 terabytes. This led us to completely rebuild our system to work like Google Maps, loading only the necessary levels of detail as the user zoomed in or navigated. This innovative approach finally allowed users to seamlessly explore even the most enormous images without overwhelming and crashing the system.
Kertai: How does syGlass make it easier to work with large and complex datasets?
Morehead: Our rendering engine, written in C++ and OpenGL, is carefully engineered for high performance. From the beginning, we anticipated that other organizations might eventually develop similar VR tools to ours, but none have matched our ability to work with data at this scale. That capability comes directly from how we’ve optimized our code and graphics pipeline.
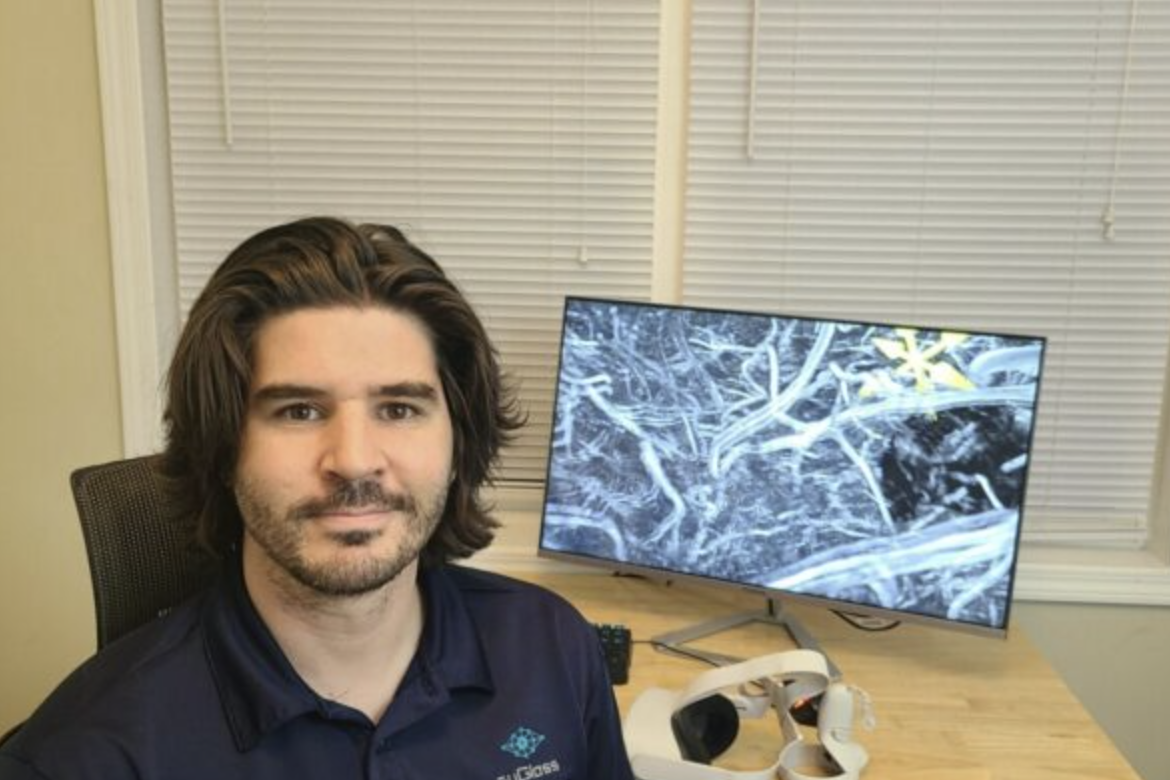
syGlass can process and display massive datasets with minimal strain on the system. Even on a standard consumer graphics card, it can render complex 3D images smoothly and allows for real-time navigation. That responsiveness is crucial because researchers need to be able to explore and analyze their data without lag or technical limitations getting in the way.
Kertai: What sets syGlass apart from other visualization tools?
Morehead: When we first introduced syGlass at the Society for Neuroscience in 2016, we thought immersive 3D viewing would be the primary attraction. And while that was exciting to many researchers, they quickly told us it wasn’t enough. They didn’t just want to see their data, they wanted to interact with it, quantify it, and extract meaningful insights.
So, we started building tools that let users do just that. For example, we added the ability to place 3D markers, count cells, and annotate structures directly within the VR environment. That level of interactivity allowed researchers not only to visualize their data in context, but also to work within it, analyzing spatial relationships, measuring volumes, and tracking biological features in ways that were difficult or impossible on traditional 2D platforms. We aren’t just providing a new viewing experience; we are creating a new working environment for science.
Kertai: Is syGlass planning to use AI-driven tools to improve data analysis further?
Morehead: While syGlass isn’t an AI company in the traditional sense, we’ve built a robust platform for human-in-the-loop AI, which allows researchers to incorporate their own trained neural networks directly into the VR environment. Initially, users asked us to automate repetitive tasks, things like segmenting data, classifying it, or tracing neural structures. That’s what led us to integrate deep learning.
Today, researchers can highlight a region of their dataset, apply an AI segmentation model, and see results in real-time. They can then adjust those results immediately, creating a fast, efficient feedback loop. This combination of immersive visualization, AI-assisted automation, and expert input is now one of syGlass’s defining strengths.
We’ve also focused on making human-AI collaboration intuitive. Sometimes the data is messy or ambiguous. There isn’t a single clear answer, and AI systems can’t resolve those tricky areas on their own. That’s where VR adds real value. It allows researchers to explore complex 3D structures, isolate difficult regions, and apply their own judgment with much more spatial context. One example is axon tracing. Axons are long, thin fibers that carry signals between nerve cells in the brain. They often twist, branch, and overlap in complex ways, which makes them very difficult for AI to follow accurately. In VR, scientists can examine these structures from any angle and guide the tracing process directly, correcting errors and resolving ambiguities with much greater precision.
Kertai: Can you share an example of how syGlass helped accelerate scientific discovery?
Morehead: One standout case involved a researcher studying human embryo development. Before using syGlass, they had to manually outline anatomical structures in 2D, an incredibly time-consuming process. After switching to syGlass in 2018, they processed 76 datasets in five years, about one every three weeks, compared to just one dataset per year before. That’s a 20- to 30-fold increase in speed, allowing them to identify muscles, tendons, and other structures much faster and with greater accuracy.
We’ve also expanded beyond research labs. One feature we developed, called syGlass Narration, lets users record themselves speaking and gesturing inside the VR environment. Others can then play back the presentation and watch a virtual avatar deliver it, creating a great tool for educational purposes.
We’ve even integrated the system with language learning and speech-to-text tools. Since 2020, about 15 U.S. school districts have adopted syGlass, using it to bring immersive data visualization into high school and college classrooms. Students can explore complex biological data firsthand, which helps them better engage with science, and even see it as a potential career path.