
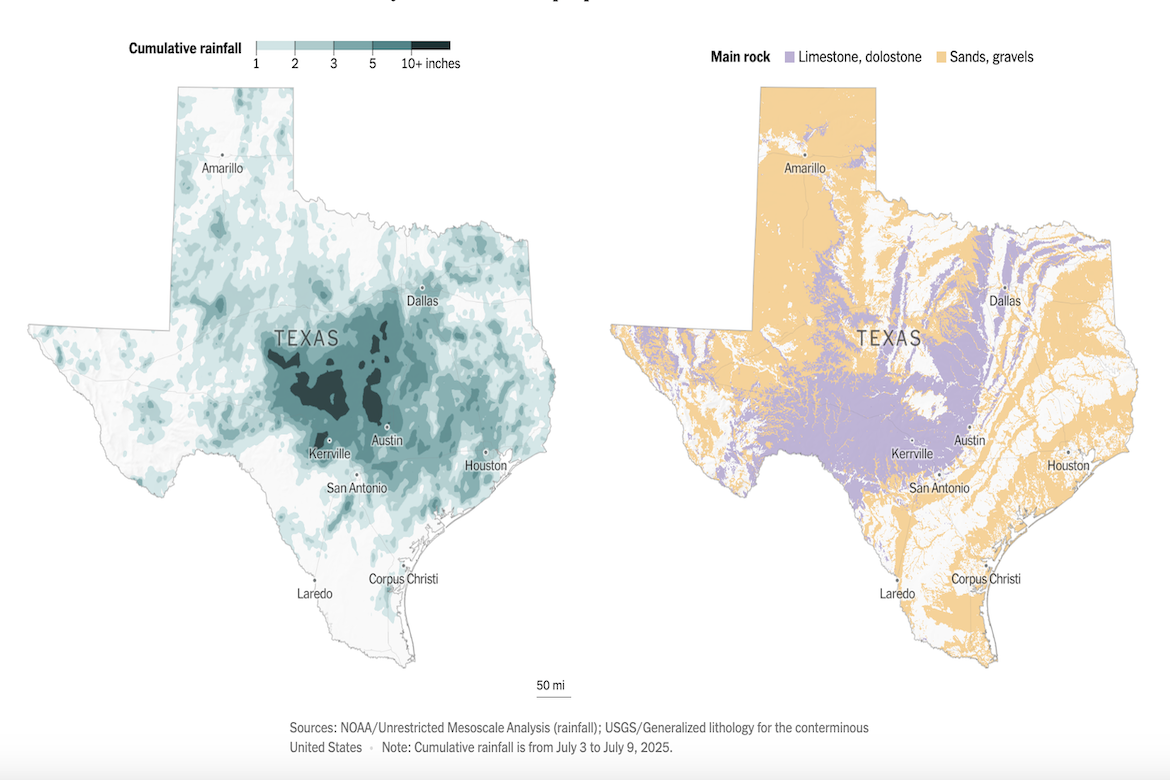
The New York Times has created a pair of maps using data from NOAA and the US Geological Society to show how extreme rainfall and geology combined to produce deadly flash floods in Central Texas in July 2025. The left map, shaded in darkening teal, shows cumulative rainfall, with the darkest areas receiving over ten inches of rain. The right map uses pale purple to mark less permeable rock like limestone and dolostone and light orange to show more permeable sands and gravels. The visualization highlights how intense rainfall over largely impermeable rock led to rapid runoff and severe flooding. It underscores how both meteorology and geology shaped the scale of the disaster.
Analyzing the Cause of Floods in Texas
previous post