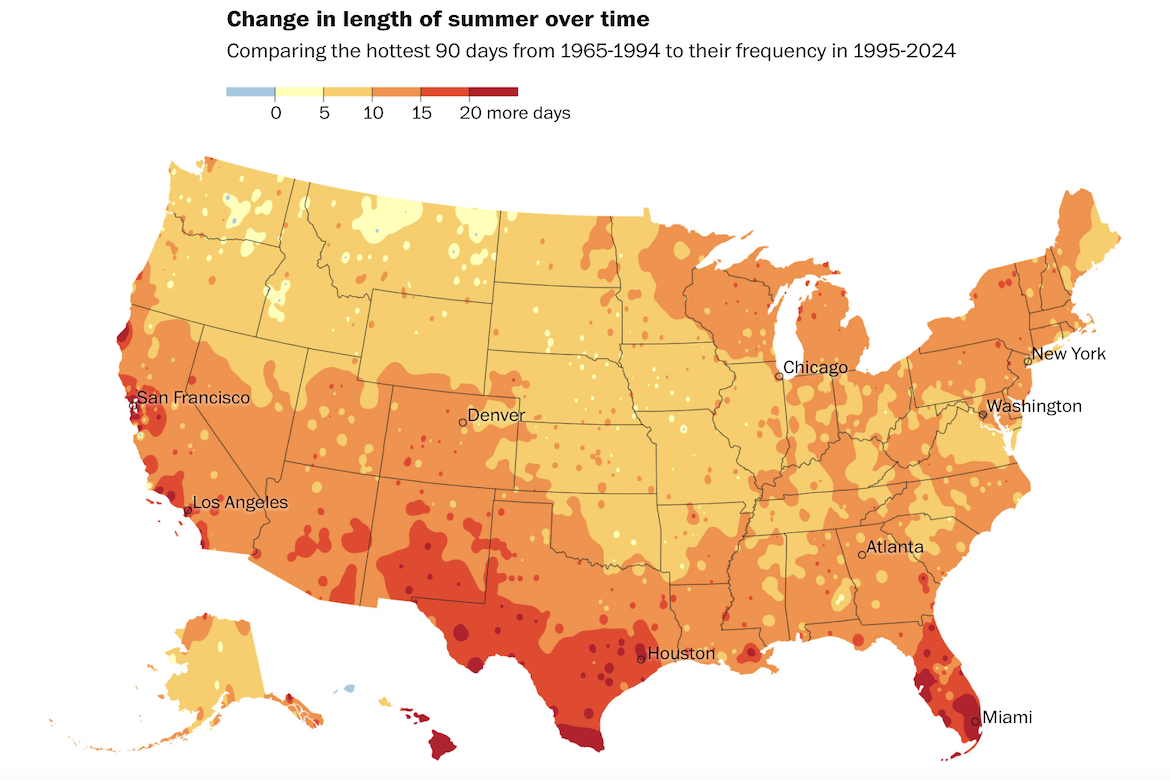
The Washington Post has mapped how the length of summer has shifted since the mid-20th century using data from NOAA’s network of weather stations. For each location, the map shows how many more or fewer days now reach summer-like temperatures compared to 30 years ago. The South and coastal regions show the largest increases, with Miami gaining 39 days and San Francisco gaining 42 days, while the Midwest sees smaller shifts and even slight declines in parts of Montana.
Observing the Length of Summer
previous post

