
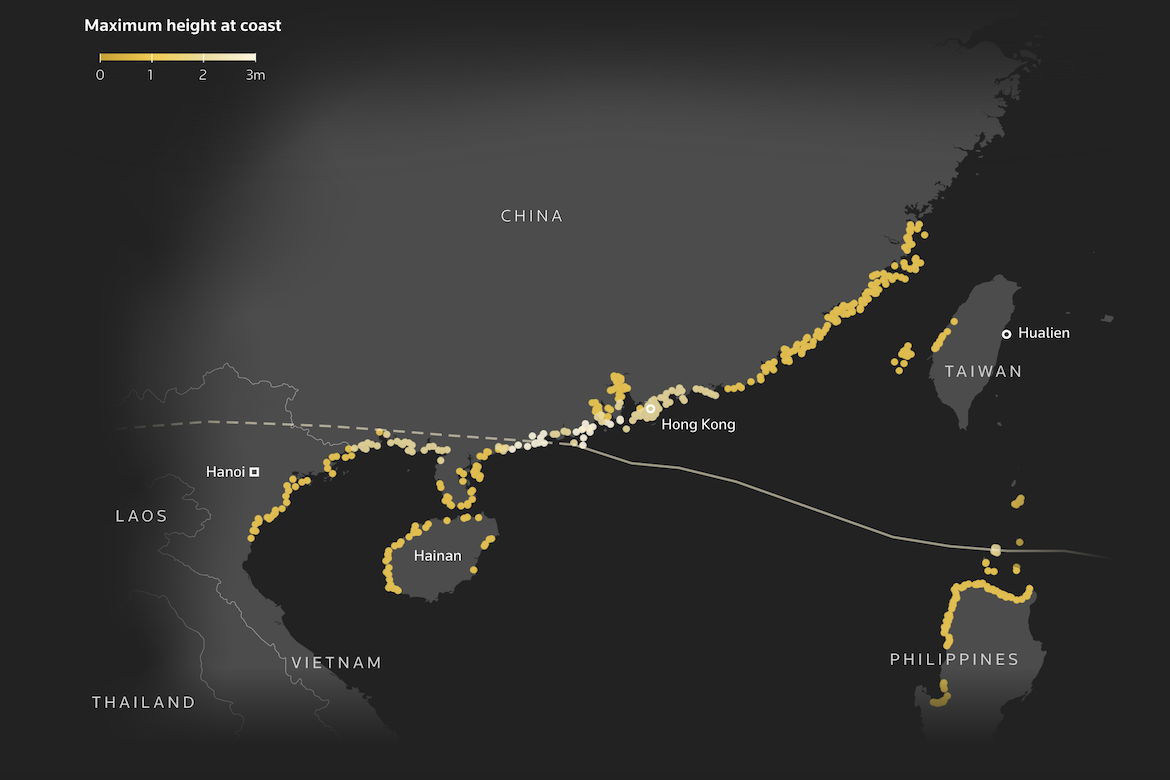
Reuters has created a visualization showing the path and wind intensity of Super Typhoon Ragasa, a powerful tropical cyclone that swept across East Asia in September 2025. The map traces the storm’s trajectory from the Philippine Sea through the South China Sea, highlighting wind speeds that peaked at approximately 160 miles per hour. A yellow gradient shows how far these powerful winds extended, with the most intense bands skirting southern Taiwan and northern Philippines, before making landfall along China’s densely populated southern coast. The visualization underscores the storm’s vast reach and helps explain the widespread damage from wind alone, even before accounting for rain or flooding.
Visualizing the Winds of Typhoon Ragasa
previous post