
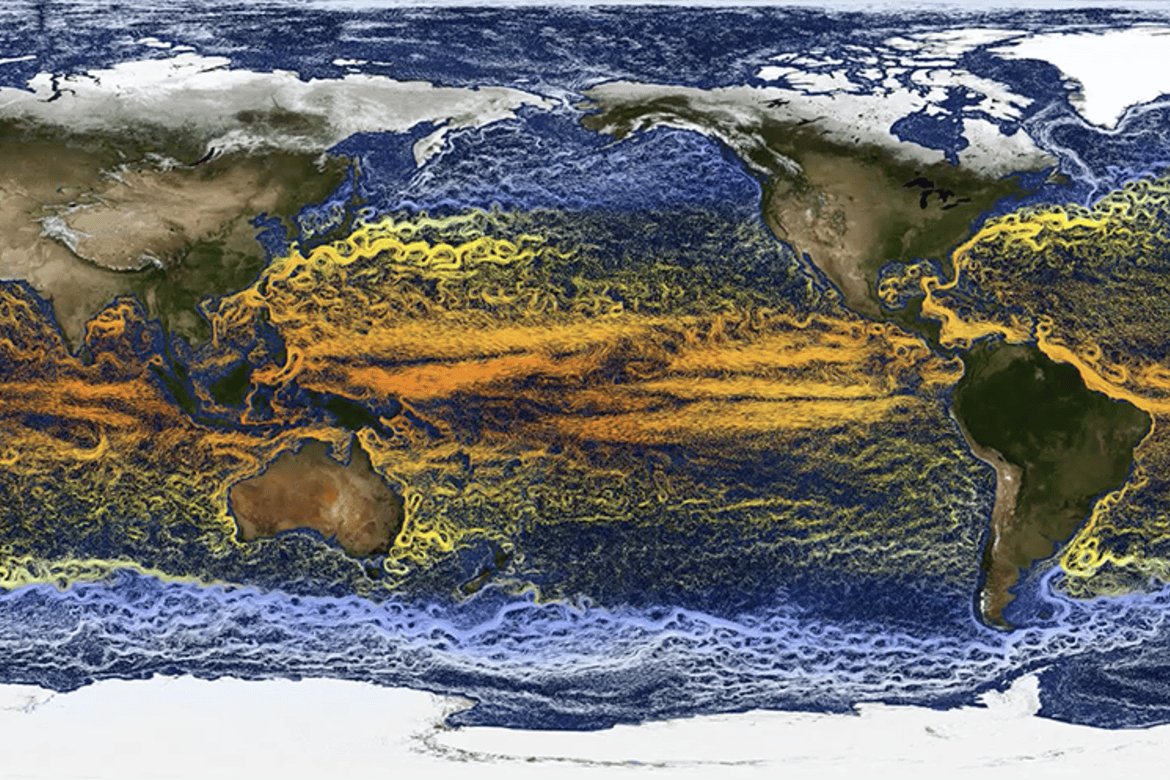
Researchers at Texas A&M University and the National Center for Atmospheric Research have created an interactive visualization showing how ocean currents and snow cover evolve globally, rendering warm currents in orange and yellow, colder currents in blue, and snow‑covered land in white. Drawing on a climate simulation called MESACLIP, the visual lets viewers explore how these patterns shift from 1850 to 2100 under different greenhouse‑gas scenarios.
Tracing Earth’s Changing Climate System
previous post