
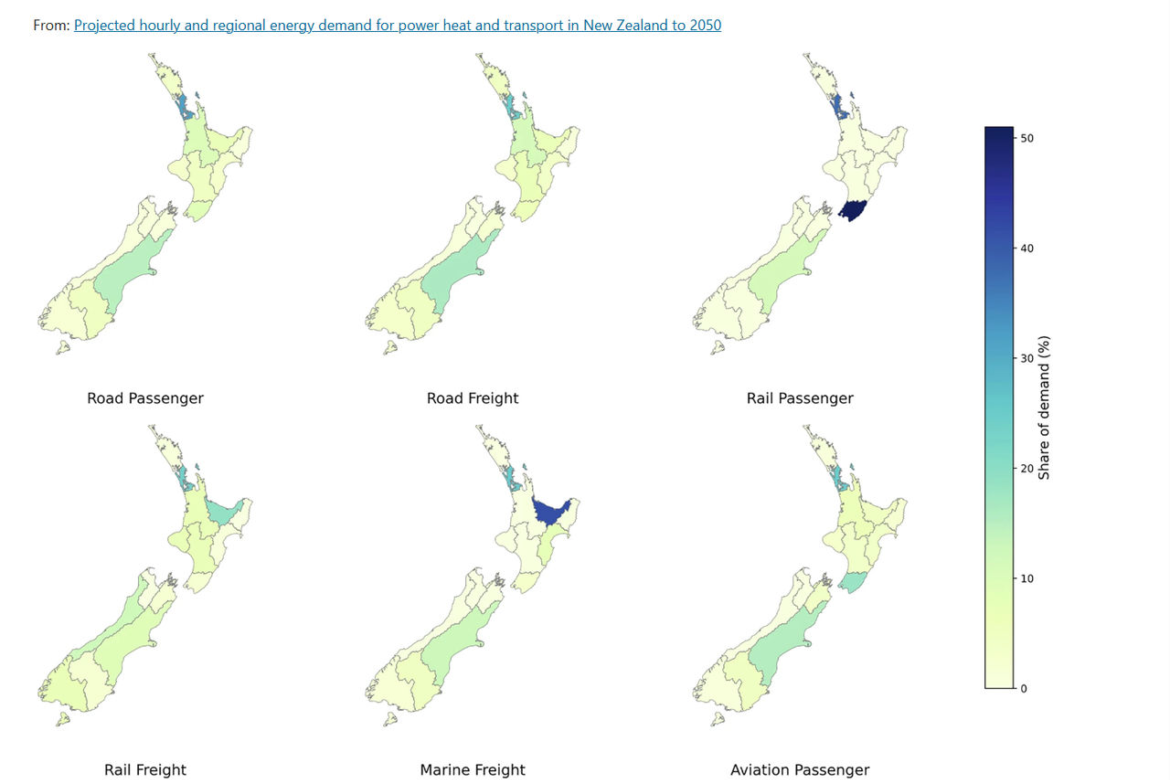
Researchers at the University of Canterbury in New Zealand have created a visual showing how regional transport demand, measured as passenger and freight activity, could evolve through 2050. The maps break down demand by mode, including road, rail, marine, and aviation, across regions. Each map shows where demand is expected to grow, with darker blue regions indicating stronger increases and lighter areas more modest change. This helps planners understand where transport systems will face the most pressure and where infrastructure and energy investments may be needed.
Mapping New Zealand’s Transport Demands
previous post