
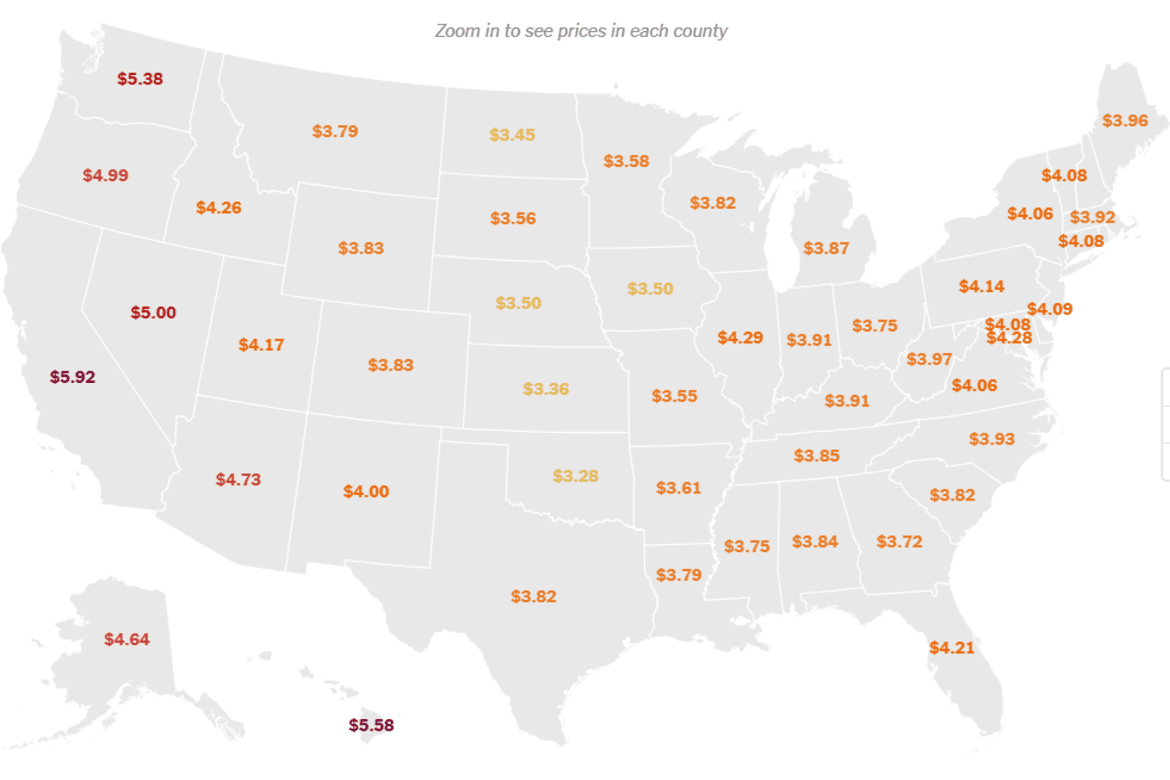
The New York Times has created an interactive visual that shows how gasoline prices vary across the United States, highlighting differences not only between states but also among individual counties. The map draws on weekly data from the American Automobile Association, illustrating how state fuel taxes, proximity to refineries, and regional distribution costs drive these price differences. The visual shows price differences using yellow for lower averages and deep purple for higher ones, offering a real‑time view of where fuel is cheapest and most expensive.
Mapping Gas Prices
previous post