
117
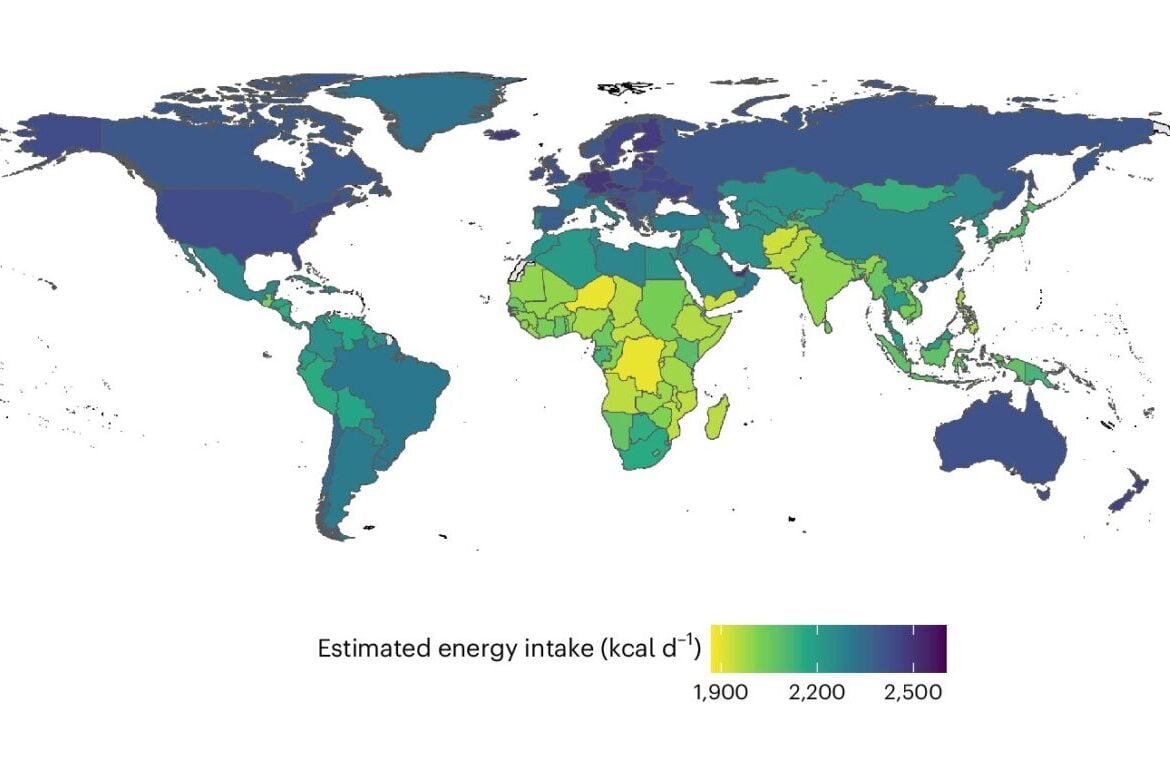
Researchers at the University of Oxford have created a visual showing how food consumption has changed around the world. The visual combines food-production data, waste estimates, dietary surveys, and nutritional requirements to estimate food consumption from 1990 to 2020. Lighter yellow indicates lower food consumption, while darker blue highlights higher-consuming regions, making it easier to compare diet-related health and environmental impacts.


