
2
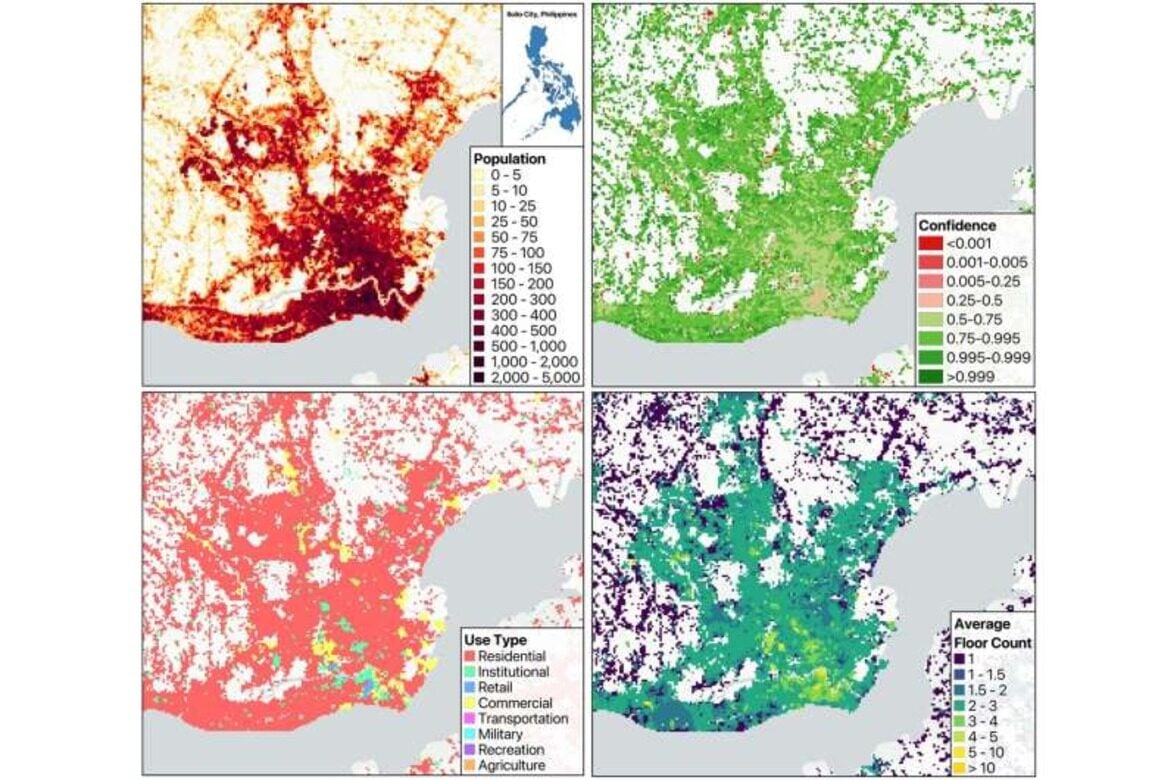
Researchers at Oak Ridge National Laboratory have built an interactive visualization called LandScan Mosaic that maps building‑level population patterns across a full day. It shows AI‑derived estimates of how many people occupy different structures and shows how confident it is in each estimate. The visual depicts Iloilo City in the Philippines, with panels showing population density (top left), data accuracy (top right), building types (bottom left), and building heights (bottom right), helping researchers better understand daily population patterns.


