
4
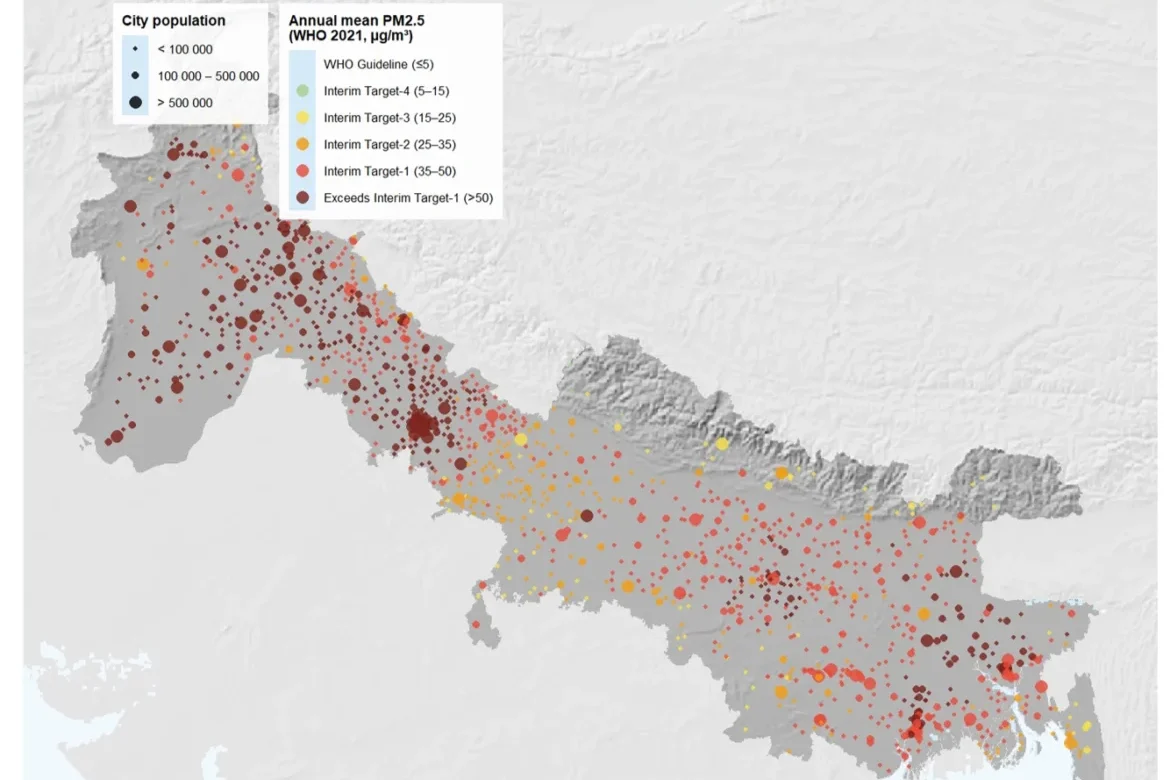
The World Bank Group has created visuals mapping daily air-pollution levels across cities in the Himalayan Foothills of India and Bangladesh. The visual uses satellite observations, ground monitors, and weather data to track PM2.5, fine particles that can enter the lungs and bloodstream and increase the risk of heart and respiratory diseases. The visualization uses darker colors to show higher pollution levels and larger circles for areas with larger populations.


