
104
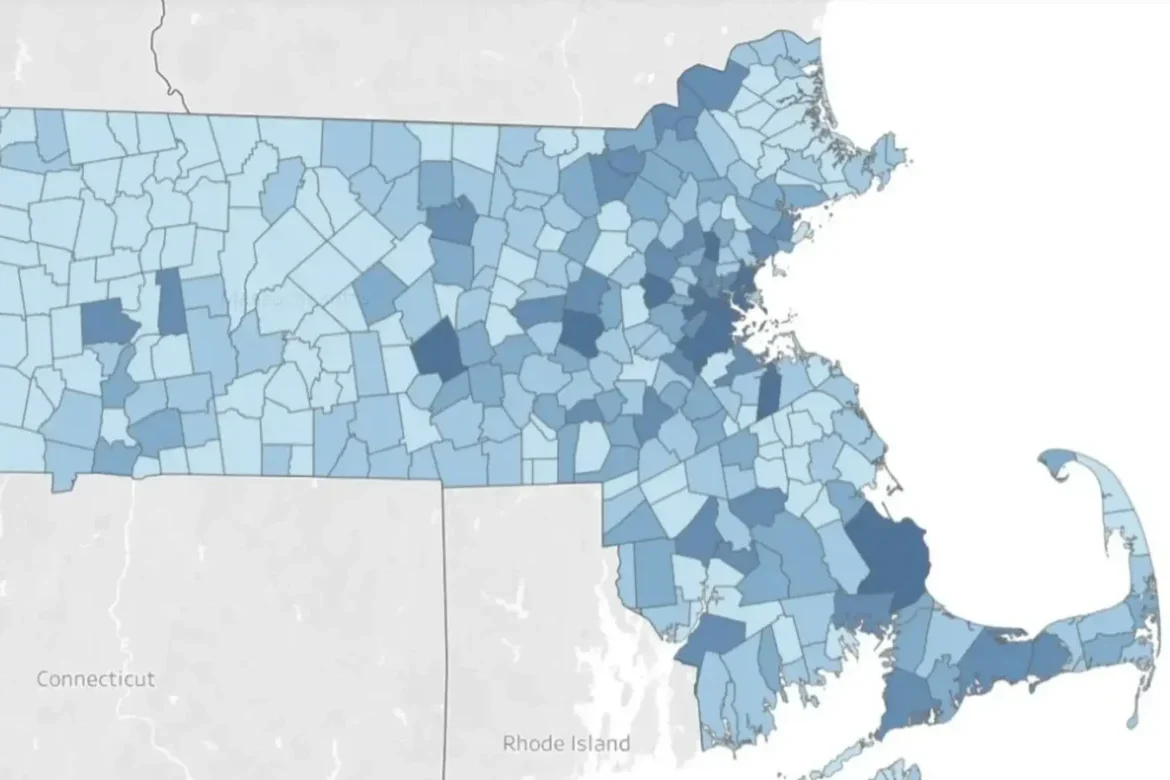
The Massachusetts government has launched a statewide housing data visualization that lets residents and policymakers track home construction across the state. Drawing on U.S. Census address records, the portal shows that 34,500 homes were added in 2025, about 15 percent of the state’s housing production goal for 2035. An interactive map uses darker blue to indicate more homes built and lighter shades to show fewer, making construction progress easy to compare.


